OEE (Overall Equipment Effectiveness) is a critical metric within pharmaceutical manufacturing, serving as a key performance indicator for evaluating operational efficiency. It quantifies how effectively production assets are utilized by combining three essential factors: Availability, Performance, and Quality.
An OEE score of 100% signifies ideal operational conditions—producing only compliant batches (100% Quality), operating at validated optimal speed (100% Performance), and experiencing no unplanned downtime (100% Availability). This level of efficiency, while aspirational, represents the benchmark for lean and compliant pharmaceutical operations.
In regulated environments, where batch integrity, equipment qualification, and process validation are paramount, measuring OEE is considered a best practice. It enables operations teams to systematically identify inefficiencies, whether they stem from prolonged changeovers, minor stoppages, or deviations affecting batch quality.
By tracking OEE and analyzing the root causes of production losses, pharmaceutical manufacturers can not only enhance throughput but also reinforce GMP compliance, reduce variability, and support continuous improvement initiatives. Ultimately, OEE acts as a strategic tool in aligning shop floor performance with regulatory expectations and business objectives.
OEE is a comprehensive performance metric for manufacturing operations. It combines three core factors—availability, performance, and quality—into a single score:
OEE = Availability × Performance × Quality
Availability (A) = Actual Run Time / Total Available Time
Performance (P) = Actual Production Quantity / Planned Production Quantity
Quality (Q) = Number of Good Units / Total Units Produced
By multiplying these three ratios—all expressed as decimals—you discover the true productive capacity of your equipment.
Why Measure OEE?
OEE provides a clear snapshot of how effectively your equipment is utilized. It helps you:
- Pinpoint losses and inefficiencies
- Set improvement targets
- Measure the impact of process upgrades
- Drive continuous improvement through Total Productive Maintenance (TPM)
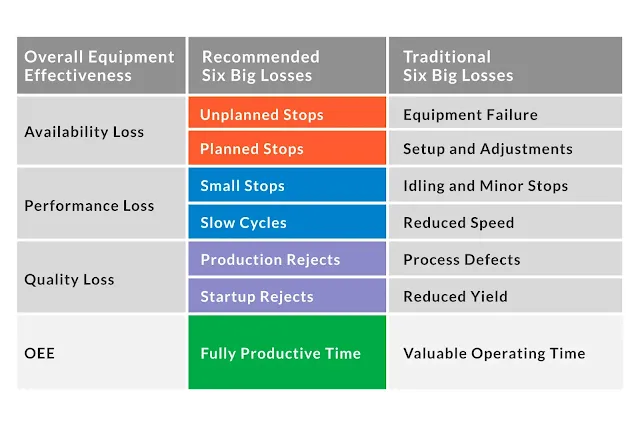
Understanding the “6 Big Losses”
The primary insight of OEE lies in tracking six frequently encountered loss areas, often referred to by the acronym SSSMCB:
- Scrap Loss / Start-Up Loss (Quality): Defective products or startup errors that require rework or scrap.
- Speed Loss / Minor Stoppages (Performance): Operating below optimal speed or facing small interruptions such as jams or adjustments.
- Changeovers / Breakdowns (Availability): Downtime due to equipment conversion or unexpected breakdowns.
By measuring OEE, you can quantify each loss, highlight its impact, and prioritize improvement efforts.
Availability improvements:
- Streamline setup and changeover routines
- Implement predictive maintenance to reduce breakdowns
Performance enhancements:
- Analyze minor stoppages and address root causes like equipment jams
- Use real-time monitoring to flag slow production
Quality optimization:
- Reduce scrap via process control methods (e.g., Six Sigma)
- Enhance start-up procedures with operator training and checklists
Real-World OEE Benchmarks
- The best-performing plants often achieve ~85% OEE
- Many start below 60%; even simple fixes can deliver +10% improvements
- With a 100% OEE score being theoretical, aim realistically for incremental gains
OEE & Industry 4.0
- Smart sensors capture machine data in real time
- Analytics platforms process the data, visualize availability losses, and predict maintenance needs
- Benefits: higher uptime, reduced scrap, and improved throughput
Integrating OEE Into a Lean Strategy
- Use Value Stream Mapping to track downtime and waste
- Combine Kaizen events with OEE tracking to measure focused improvement initiatives
- Set daily feedback integrating OEE into production floor routines (e.g., shift‐end dashboards)
Related Metrics: OLE, TEEP, and KPI Dashboards
- Total Effective Equipment Performance (TEEP) includes utilization time
- OEE → OLE (Overall Line Effectiveness): applied across entire production lines
- OEE dashboards often combine qualitative insights (Root Cause) with quantitative metrics
Step‑by‑Step OEE Implementation Guide
- Collect data: start with time sheets, equipment logs, and production reports
- Calculate baseline: determine current A, P, Q, and OEE
- Identify top losses: use Pareto analysis to find biggest contributors
- Focus on improvements: tackle one loss type at a time (e.g., changeovers)
- Apply solutions: e.g., SMED for faster changeovers, poka‑yoke for quality
- Monitor & iterate: track results, adjust, and scale across plants
Conclusion
Overall Equipment Effectiveness is more than just a formula—it’s a gateway to systematic improvement. By carefully tracking availability, performance, and quality, you can spot where losses lurk, implement targeted countermeasures, and propel your operations toward world-class efficiency.
With consistent OEE tracking—and informed strategies to tackle the six big losses—you'll boost uptime, speed, and quality simultaneously, setting the stage for long-term success. Ready to optimize your equipment? Start calculating.

.webp)


.webp)


.webp)


0 Comments